70-779 무료 덤프문제 온라인 액세스
| 시험코드: | 70-779 |
| 시험이름: | Analyzing and Visualizing Data with Microsoft Excel |
| 인증사: | Microsoft |
| 무료 덤프 문항수: | 118 |
| 업로드 날짜: | 2025-12-04 |
Note: This question is part of a series of questions that present the same scenario. Each question in the series contains a unique solution that might meet the stated goals. Some question sets might have more than one correct solution, while others might not have a correct solution.
After you answer a question in this section, you will NOT be able to return to it. As a result, these questions will not appear in the review screen.
Your company has sales offices in several cities.
You create a table that represents the amount of sales in each city by month as shown in the exhibit.
You need to ensure that all values lower than 250 display a red icon. The solution must ensure that all values greater than 500 display a green icon.
Solution: You create a new conditional formatting rule that uses the Format only cells that contain rule type.
Does this meet the goal?
You have the following tables in a data model.
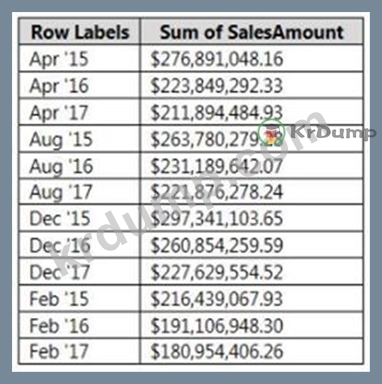
You create a PivotTable to display SaleAmount by Month. A sample of the results are shown in the following table.
You need to ensure that the data appears in chronological order.
What should you do?
You have an Excel spreadsheet that contains a PivotChart.
You install Microsoft Power BI Publisher for Excel.
You need to add a tile for the PivotChart to a Power BI dashboard.
What should you do?
You have a measure named SalesGrowth that calculates the percent of sales growth. The measure uses the following formula.
([Total Sales Current Year] - [Total Sales Last Year]) / [Total Sales Last Year] Total Sales Current Year is a measure that calculates the sales from the current calendar year. Total Sales Last Year is a measure that calculates the sales from the previous calendar year.
You need to create a KPI that displays a red icon when the sales growth is less than last year.
What should you use to define the target value?
Note: This question is part of a series of questions that present the same scenario. Each question in the series contains a unique solution that might meet the stated goals. Some question sets might have more than one correct solution, while others might not have a correct solution.
After you answer a question in this section, you will NOT be able to return to it. As a result, these questions will not appear in the review screen.
Your company has sales offices in several cities.
You create a table that represents the amount of sales in each city by month as shown in the exhibit.
You need to ensure that all values lower than 250 display a red icon. The solution must ensure that all values greater than 500 display a green icon.
Solution: You modify the conditional formatting rule, and then set a new value for the yellow icon.
Does this meet the goal?
